Automated Memory Forensics

From Memory Dump to
Attack Story

DeepProbe is an open-source memory forensics tool built for teams that need faster memory dump analysis, stronger forensic correlation, and clear attack chain analysis during incident response and threat hunting.

DeepProbe automated memory forensics — live demo of analysis, correlation, and attack chain output

Live demo — DeepProbe analyzing a memory image, correlating artifacts, and building an attack chain in real time.

What Is Memory Forensics?

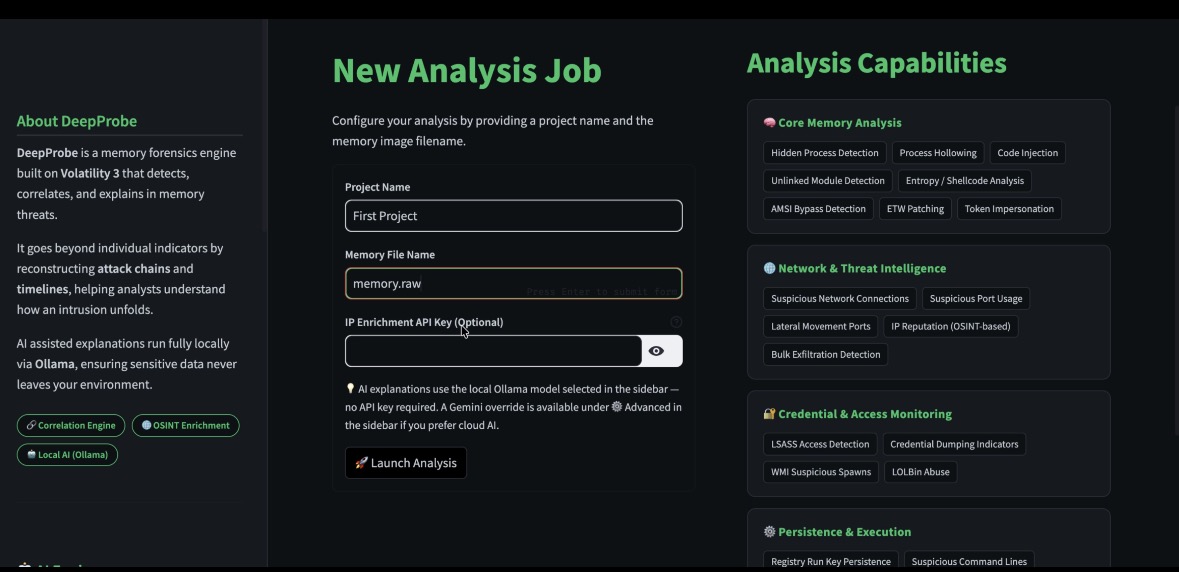
Memory forensics analyzes volatile memory to recover attacker activity that may never touch disk. It is essential for malware memory analysis, Windows memory forensics, live response, and post-compromise memory investigation.

!

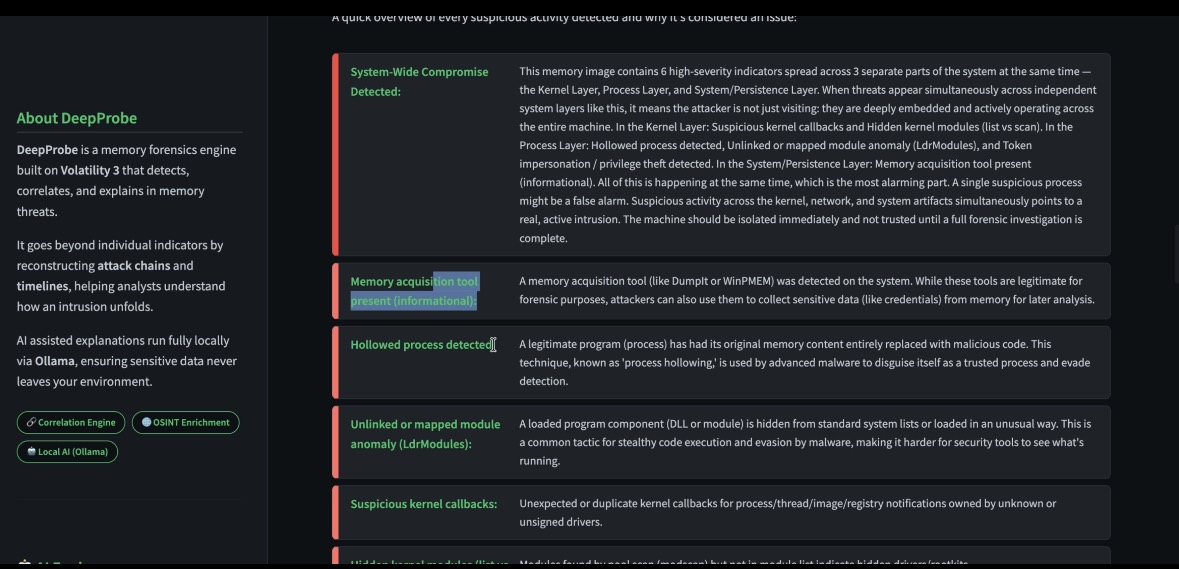
Extraction ≠ Understanding: Traditional tooling surfaces artifacts, but analysts still need to manually connect process injection, sockets, handles, and suspicious lineage.

!

The Manual Burden: Incident response teams need DFIR automation that reduces turnaround time without hiding critical evidence.

V2 FOCUS

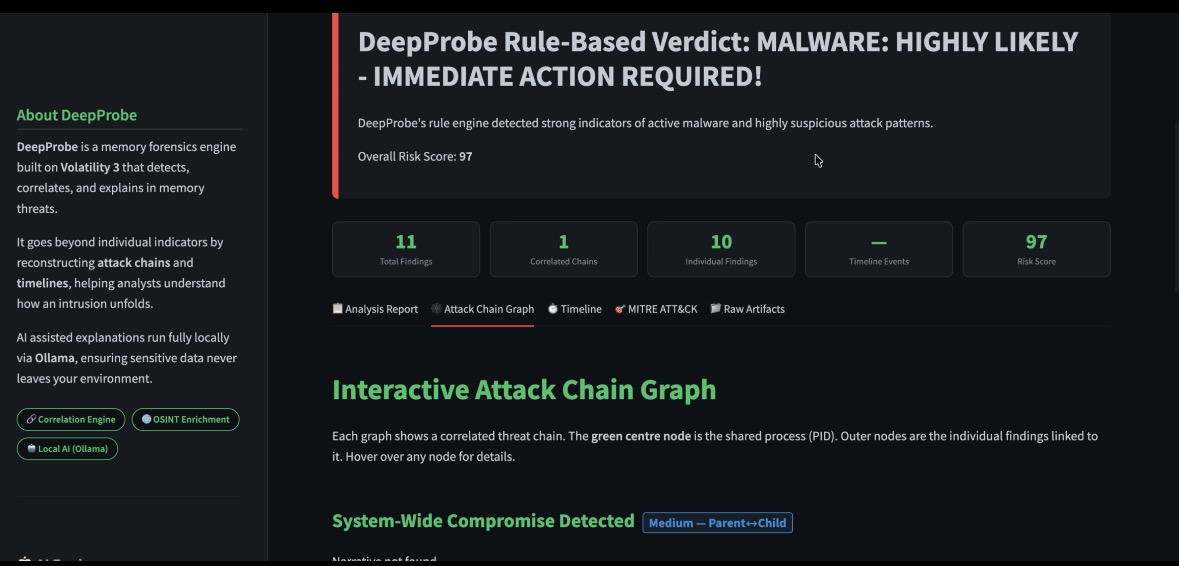
"Memory forensics should explain the attack, not just expose artifacts."

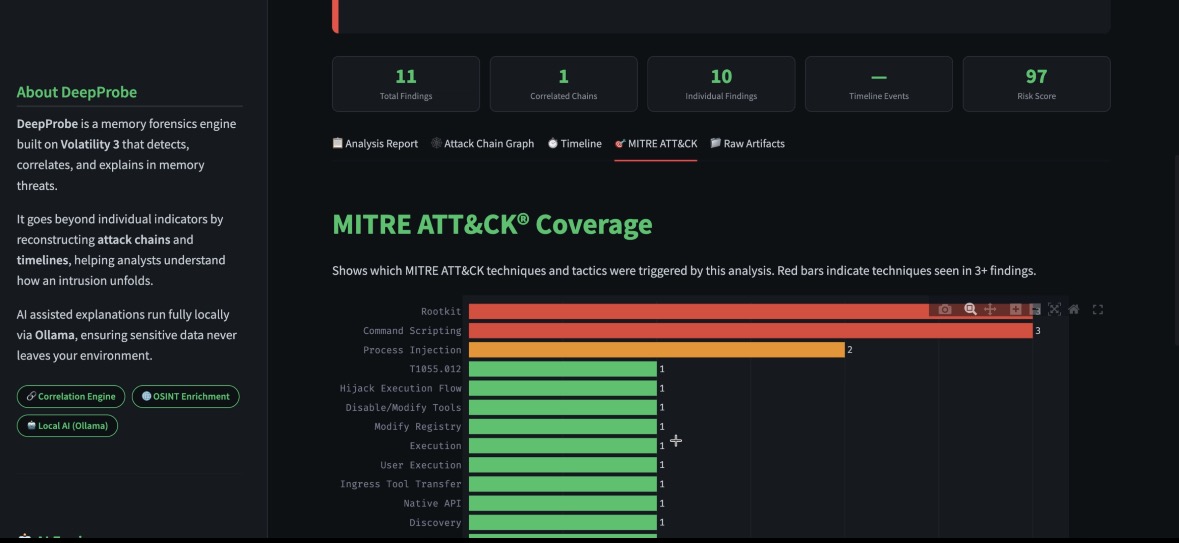
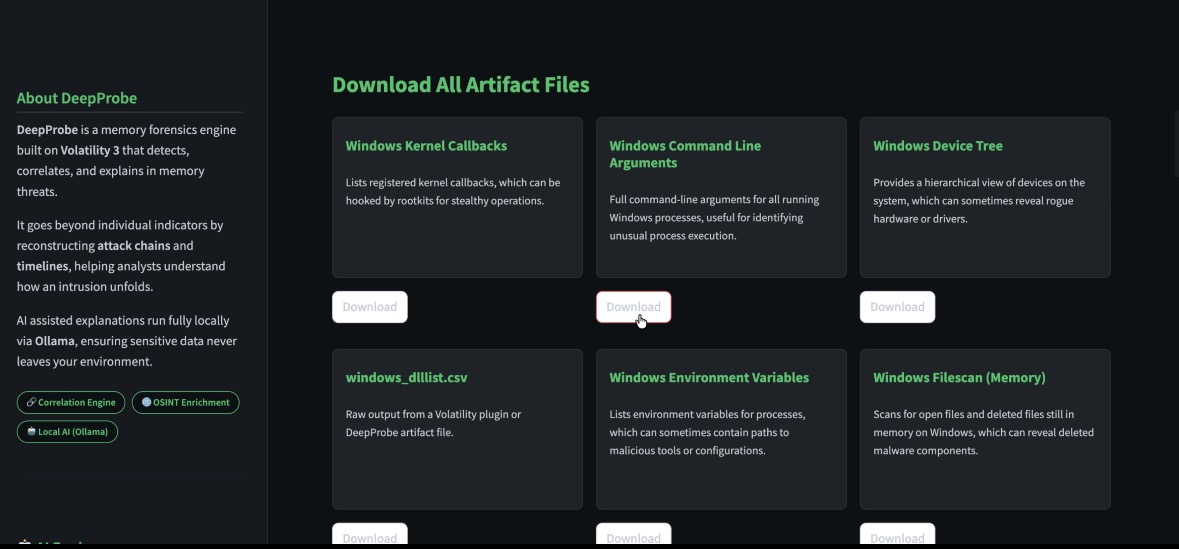
  • Automated Plugin Sequencing
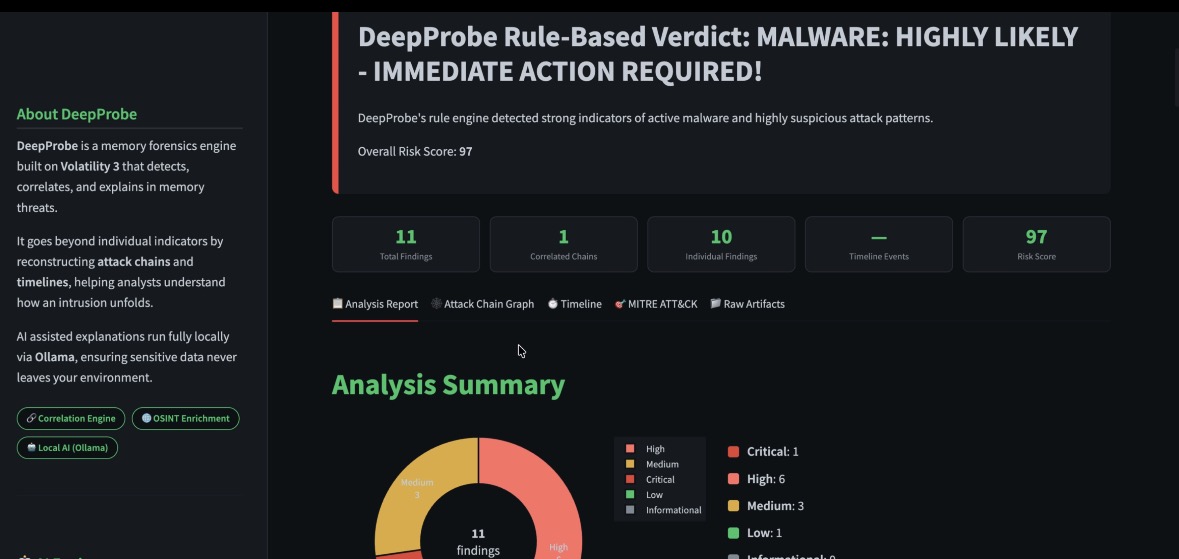
  • Structured Rule-Based Evaluation
  • Unified Attack Scenarios
DeepProbe New Analysis Job configuration UI — memory image, project name, IP enrichment, analysis capabilities

Configure a new analysis job in seconds — paste a memory image filename, enable OSINT enrichment or local AI, and launch.

The v2 Capability Set

Reducing operational friction by moving from fragmented indicators to coherent attack chains for automated memory analysis and enterprise incident response.

Auto-Analysis

DeepProbe automates plugin execution so analysts can focus on high-confidence decisions instead of manual sequencing.

Structured Rules

Classified, scored, and MITRE-mapped detections across process, kernel, and network layers.

Deep Correlation

Same-PID, parent-child, and behavioral co-presence signals are linked into a single investigation graph.

Evidence-Bound AI

AI-assisted interpretation stays grounded in extracted evidence for analyst review rather than replacing forensic reasoning.

DeepProbe In Action

Real output from a live memory analysis run. DeepProbe produces a verdict, risk score, severity breakdown, correlated chains, and full MITRE ATT&CK® mapping — all from a single memory dump.

DeepProbe rule-based verdict: MALWARE HIGHLY LIKELY — IMMEDIATE ACTION REQUIRED. Overall Risk Score 97, 11 total findings, 1 correlated chain.

The verdict panel — an overall risk score of 97/100 with 11 findings, 1 correlated attack chain, and an immediate-action recommendation from the rule engine.

97
Risk Score
11
Total Findings
1
Correlated Chain
3
Forensic Layers Hit
DeepProbe analysis summary donut chart — Critical 1, High 6, Medium 3, Low 1 across 11 findings

Severity breakdown — 1 Critical, 6 High, 3 Medium, 1 Low across 11 total findings, visualized in an interactive donut chart.

DeepProbe MITRE ATT&CK coverage bar chart — Rootkit, Command Scripting, Process Injection, T1055.012, and more automatically mapped

MITRE ATT&CK® coverage — DeepProbe automatically maps each detected behavior to framework techniques. Red bars indicate techniques triggered 3+ times.

Forensic Visibility

Actionable insights delivered through a modern interface that supports RAM forensics and attack narrative reconstruction — from raw graph to written story.

Interactive Attack Chain Graph

Instead of isolated alerts, DeepProbe renders an interactive correlation graph. The green center node is the shared process (PID); outer nodes are individual memory findings linked to it. Hover any node to expand its forensic detail.

DeepProbe interactive attack chain correlation graph — green center PID node with surrounding memory artifact nodes for DFIR analysis

System-Wide compromise detected — nodes span Kernel, Process, and System/Persistence layers simultaneously.

DeepProbe AI-assisted explanation panel — evidence-bound AI explaining hollowed process, hidden modules, token impersonation, and kernel callbacks in plain English

Click "Ask AI" on any chain node to get an evidence-grounded plain-language explanation. AI runs locally via Ollama — no data leaves your environment.

AI Explanation Panel

DeepProbe's AI interprets each finding in context of the full evidence set. It explains what hollowed processes, hidden kernel modules, and token impersonation mean together — not as isolated alerts. All inference runs on Ollama locally — sensitive memory data never leaves your environment.

Attack Chain Flow Diagram

DeepProbe reconstructs the full attacker sequence as a step-by-step flow: Hollowed Process → Hidden Module Loaded → Token Impersonation / Privilege Abuse → Kernel Callbacks Suspicious → Modules Hidden vs Modscan → Dumpit Present. Each arrow represents a forensically linked transition across system layers.

DeepProbe attack chain flow diagram — Hollowed Process to Hidden Module Loaded to Token Impersonation to Kernel Callbacks across Kernel, Process, and System/Persistence layers

A 5-node multi-layer intrusion chain detected across Kernel, Process, and System/Persistence layers in a single memory image.

DeepProbe attack story narrative — 'How DeepProbe Uncovered the Threat' with system-wide compromise detected across 3 forensic layers

"The Attack Story" — a correlated prose narrative that synthesizes all indicators into an analyst-readable incident timeline with containment guidance.

The Attack Story

DeepProbe doesn't just enumerate findings — it writes the attack story. A correlated prose narrative explains what happened across the Kernel, Process, and System/Persistence layers, why it matters, and what immediate actions should be taken.

This output is designed to be shared directly with leadership and IR leadership without requiring them to read raw plugin output.

Every Finding, Explained

Each detected indicator includes a plain-language explanation — what it is, why it is suspicious, and how it fits into the broader compromise pattern.

Findings cover process hollowing, hidden kernel modules, LDR module anomalies, suspicious kernel callbacks, credential access indicators, and more — all severity-scored and prioritized for analyst review.

System-Wide Compromise Detected
Hollowed Process (Process Layer)
Unlinked/Mapped Module Anomaly — LdrModules
Suspicious Kernel Callbacks
Hidden Kernel Modules (list vs scan)
DeepProbe detailed findings list — System-Wide Compromise, Memory Acquisition Tool, Hollowed Process, Unlinked Module, Kernel Callbacks, each with plain-English explanations

Each finding row includes severity, finding type, and a plain-English explanation that a non-specialist can understand — making escalation faster.

DeepProbe raw artifact download panel — Windows Kernel Callbacks, Command Line Arguments, Device Tree, DLL List, Environment Variables, Filescan download cards

All extracted artifact files are available for download — Windows Kernel Callbacks, Command Line Arguments, Device Tree, DLL List, Environment Variables, Filescan, and more.

Full Artifact Access

Beyond the dashboard and narrative, DeepProbe gives you direct access to every raw artifact file extracted from the memory image for external review, chain-of-custody documentation, or import into a SIEM.

Artifacts include Windows kernel callbacks, process command-line arguments, device trees, DLL lists, file scans, and environment variables — all downloadable as structured files.

Windows Kernel Callbacks
Command Line Arguments
Windows Device Tree
DLL List (windows_dlllist)
Environment Variables
Filescan (Memory)

Technical Deep Dive

DeepProbe is designed to rank not only as a product page, but as a practical educational resource for DFIR teams evaluating Volatility alternatives, automated workflows, and memory investigation architectures.

How DeepProbe Differs From Volatility

Volatility remains valuable for artifact extraction, but many teams need a Volatility alternative that emphasizes orchestration, prioritization, and attack chain analysis in addition to raw plugin output.

  • Automates plugin sequencing based on investigative goals.
  • Correlates process, network, and kernel findings into analyst-ready narratives.
  • Supports AI-assisted interpretation bounded by forensic evidence.
  • Improves communication between responders, threat hunters, and leadership.

Architecture & Methodology

The workflow starts with memory acquisition and artifact extraction, then normalizes objects into a structured dataset for scoring, tagging, and cross-artifact correlation.

This approach is especially useful when teams need repeatable malware memory analysis and evidence review during fast-moving enterprise investigations.

Memory Forensics Use Cases

  • Ransomware triage where fileless activity must be confirmed from RAM.
  • APT investigations that require linked evidence across process trees and sockets.
  • Insider threat reviews where live memory captures expose in-memory tools.
  • Threat hunting workflows that prioritize suspicious lineage and stealth techniques.

Automated DFIR Workflow

  1. Acquire or ingest the memory image.
  2. Run automated memory analysis with prioritized forensic modules.
  3. Normalize and score process, kernel, and network artifacts.
  4. Correlate findings into attack chain views and investigation summaries.
  5. Escalate high-confidence evidence for incident response and remediation decisions.

Memory Forensics FAQ

Answers aimed at high-intent searches around DFIR automation, RAM forensics, and memory dump analysis.

What is memory forensics?
Memory forensics is the examination of volatile memory to recover active processes, injected code, credentials, and runtime artifacts that are often invisible in disk-only investigations.
What is Volatility?
Volatility is a popular memory forensics framework used to extract artifacts from memory images. Teams evaluating workflow scale often compare it with tools that add orchestration and correlation on top.
Is DeepProbe a Volatility alternative?
DeepProbe can be used as a Volatility alternative when the goal is not just extraction, but also automated memory analysis, forensic correlation, and attack-story generation for responders.
How does automated memory analysis work?
It combines collection logic, plugin orchestration, evidence normalization, scoring, and cross-artifact correlation so investigators receive prioritized output instead of disconnected raw results.
What is RAM forensics?
RAM forensics is another term for memory forensics and usually refers to analyzing a system's volatile memory to detect fileless malware, active sessions, injections, and transient attacker behavior.
Can DeepProbe help incident response teams?
Yes. DeepProbe supports incident response teams by accelerating triage, organizing evidence, and translating memory artifacts into attack chain analysis that leadership and responders can act on quickly.
How does forensic correlation work?
Forensic correlation links artifacts by time, lineage, identifiers, and behavior so analysts can tell whether several suspicious events are isolated anomalies or part of the same compromise.
What is attack chain analysis in DFIR?
Attack chain analysis reconstructs how the adversary executed, persisted, moved, and impacted the host so teams can prioritize containment, scope, and eradication steps.